YouTube ranking: How to use analytics to optimize your video

If you’re trying to optimize your videos to get YouTube ranking them (as well as Google), then you need to do three things. Firstly, you need to understand what’s working. Second, you want to discover where there are opportunities to do better. And thirdly, you should assess how your search performance is progressing over time. In this post, we’ll look at the insights you can glean from YouTube Analytics and what they can tell you about your YouTube SEO strategy.
Table of contents
YouTube SEO is part search, part social
YouTube is as much a social network as it is a search engine. So optimizing content for discovery on YouTube is not only about getting the highest Google and YouTube rankings. It’s also about ensuring you appear frequently in the recommended video results, and generate as much engagement (in terms of shares, likes and comments) as possible on your videos.
With YouTube SEO, the search and social elements often blend together. Marketers experienced in one or other of the disciplines might find this counterintuitive. For example, one of the ways to improve Google and YouTube rankings is by getting more subscribers to your channel, and increasing the average watch time of all your videos.
As such, with all the metrics highlighted in this post – the goal is really about increasing visibility across both YouTube and Google for your videos on YouTube.com, straddling both the search and social elements of the platform.
Individual video performance in YouTube
When measuring the success of individual videos, there are six key questions to ask. Together these will give you a holistic picture of how well a video is performing in your YouTube SEO strategy. They are:
- How much traffic is coming to the video?
- Where is the traffic coming from?
- What are users searching for?
- Are users clicking on the video when they see it?
- Are users watching the video or clicking away?
- What is the impact on users who watch the video?
I’ll cover each of these in turn, exploring the metrics and reports in YouTube Analytics which can give us comprehensive answers.
1. How much traffic is coming to the video?
This question is best answered through the metric “views”, which ostensibly equates to a pageview in website analytics. How YouTube precisely delineates between a “view” and simply a 200 response code on a video page is a bit vague, but Google tries to remove bot traffic and non-genuine views as much as is possible.
What’s generally not clear from the surface-level metrics, however, is how many views are users genuinely intending to watch a video, vs those ignoring it and trying to skip past it as quickly as possible. Particularly when investing in YouTube TrueView video advertising campaigns, this can cause problems. It may look like you’re getting a ton of views on your videos! In reality, how many of those users are truly paying attention to the video? How many are just trying to skip past it as quickly as possible?
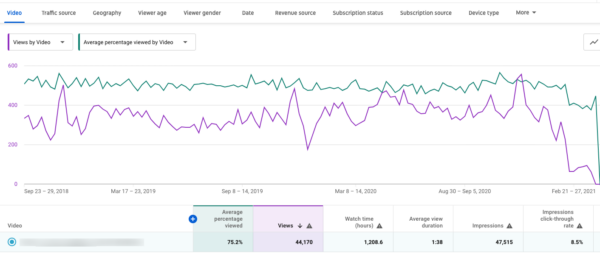
An imprecise but effective method to estimate how many genuine views you are getting (i.e. users who are actively engaged with the video) is to multiply the number of overall views by the average percentage watched. Of course, this method doesn’t take into account videos with high engagement for the first half and then a significant drop-off. But nevertheless, it acts as a reasonable proxy to determine “engaged views”. To get this metric, you’ll need to pull view data from YouTube, and then do the calculation yourself elsewhere.
2. Where is the traffic coming from?
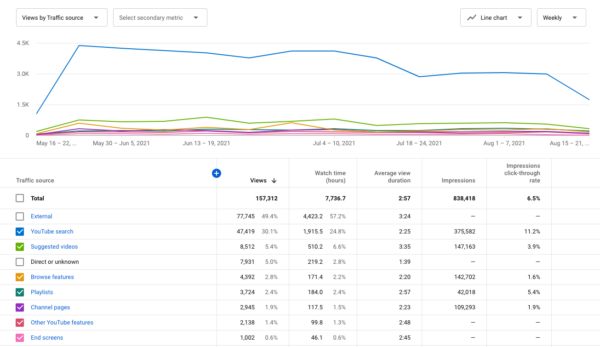
The place to find this information is in the Traffic source report of YouTube Analytics. This report tells you where your views are coming from, and the journeys users take to find your content.
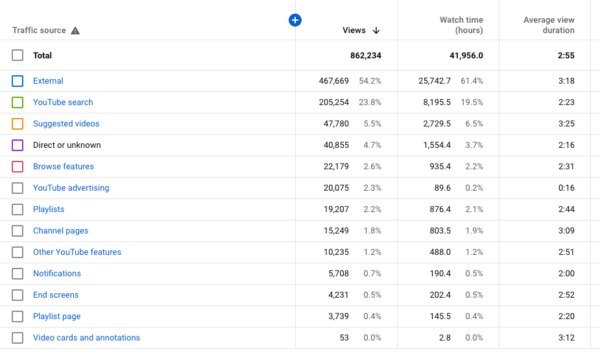
- “External” refers to embedded players on other websites (usually) your own website, links from websites and Google Search.
- “YouTube Search” means anyone typing something in the YouTube search bar.
- “Suggested videos” is when a video appears in the YouTube sidebar on any watch page.
- “Direct or unknown” is views which can’t be attributed elsewhere.
- “YouTube Advertising” is mostly InStream and TrueView ads
A well-optimized video will show significant amounts of traffic from multiple different traffic sources. Particularly key to knowing that your video is performing well on YouTube as a platform, not just as a piece of video marketing more broadly, is seeing that lots of views are coming from YouTube Search and Suggested Videos. If these sources aren’t delivering lots of views, then your video is probably not very well optimized. In that case you should think about adjusting the title, the thumbnail and perhaps updating the content.
In addition to traffic from YouTube, you’ll want to see Google Search is delivering traffic to your videos too. To see this, click on ‘External’ and then see how much traffic is coming from Google Search.
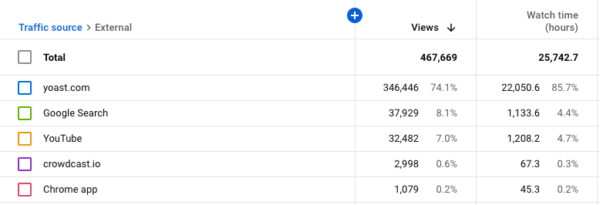
If you see that the only traffic source for a video is your own website, then this is a good indicator to you that the video isn’t really performing very well on YouTube. This isn’t necessarily because the video is not well optimized. It might just be because the video itself requires too much prior context to be interesting to a YouTube audience typically unfamiliar with your brand. In these cases, it can often be beneficial to remove the video from YouTube and instead host it on your website via a paid video hosting platform. Too much badly-performing content on YouTube will drag down the value of your channel more broadly.
3. What are users searching for?
If you look further into the traffic sources report, you can discover precisely what users were searching for on YouTube to find your video. Remember that similar data you could get for Google keywords in the heady days before (not provided), well, it’s back. But only for YouTube!
If you click on ‘YouTube Search’ in the traffic sources report, you’ll see another screen that details the keywords searched for, and the number of views each generated. You can view this data over time, and for each video individually (as well as all videos together).
You can also export this data, with a limit of 500 results. It’s worth noting that the keyword data is clearly grouped in some way, likely similar to a “broad match” keyword as seen in the Google Ads Keyword Planner.

This data can be extremely useful! It can help you work out what types of terms are driving traffic, and thereby inform your creative strategy and content planning.
Read more: How to do keyword research for YouTube »
4. Are users clicking on the video when they see it?
You can determine how many users click on the video when they see it using the “impressions click-through rate” data. This metric essentially tells you how often your video is clicked vs how often it is shown across YouTube search and suggested videos.

You’ll want this metric to be going up over time, and to be correlated with average view duration. If both trend lines are moving up and to the right, that tells you two things. For one, it tells you that users are interested in your videos when they see them, and also that they are watching the videos when they click through.
Note, however, that this metric can change quite wildly if there is a sudden drop-off in the number of impressions a video is getting e.g. if YouTube stops ranking it for a specific keyword. Keep an eye on this, and map the impressions against the impressions click-through rate. We want to see the impressions staying steady or increasing, and the CTR increasing with it.

Things fluctuate a lot across niches and topics, but generally anything above a 10% impression click-through rate is good. If you seem to have a low or decreasing impression click-through rate, then this is a clear indication that something isn’t working.
It may be that your thumbnails are not doing the job they are supposed to, and need a good rethink. Consider adding more color, making any text bigger, and perhaps including a better or more expressive photograph into the mix. A low impression click-through rate could also be indicative of a bad video title. For YouTube SEO, video titles need to attract clicks more than they need to match various keywords. So consider changing your title as well if things aren’t looking too good.
Once you’ve made some changes to your thumbnail or title, go back into YouTube Analytics and track this metric over time. If the changes you’ve made have been positive, you should see the impression click-through rate trending upwards.
5. Are users watching the video, or clicking away?
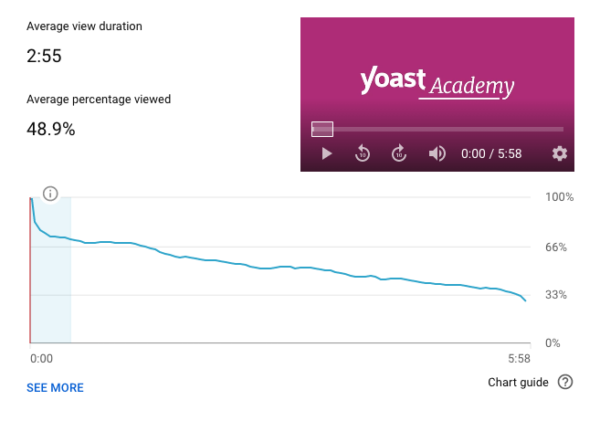
The best way to get an answer to this question is by looking at the engagement graph for an individual video within YouTube Analytics.
This graph shows you where users are dropping off and where they are continuing to watch. The ideal graph looks like a flat line. Where you see dips, this is an indication that the video is not capturing the attention of the audience sufficiently. Most videos see a small drop at the start and finish, but you should aim for these to be less pronounced by creating content with a punchy, compelling opening and a clear call-to-action at the end. If there are stark dips in the middle, this tells you that that particular part of the video is turning users away, or making them skip to later points in the video.
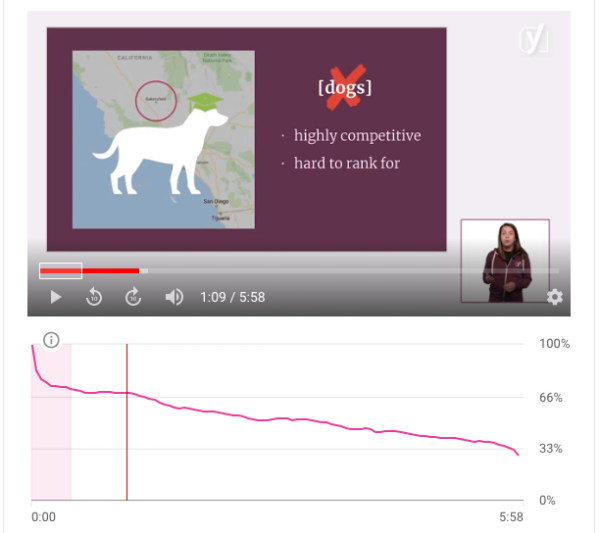
Alongside the engagement graph, “average percentage viewed” is a metric that really tells you how well a video is performing relative to your other videos, and videos globally. Broadly speaking, 50% is a benchmark for average performance for a 3-10 minute video. Longer videos will tend to have a lower average percentage viewed.
For shorter videos (< 10 minutes), 65%+ retention is excellent, 50%+ is good, 35-50% is not so good, <35% is poor. For longer videos (>10 minutes), 50%+ retention is excellent, 35%+ is good, 20-35% is not so good, <20% is poor.
6. What is the impact on users who watch the video?
There are two metrics you should care about in regards to this question. The first is “watch time”. Watch time basically tells you how long users are spending watching our videos. It’s a slightly muddy metric (it can be inflated by lots of low-quality views secured through advertising). But nevertheless it acts as a good relative metric for comparing the impact different videos are having in relation to one another. And if we assume that time spent with our content translates into brand engagement and affinity, then we can use this metric as a proxy for impact.
In YouTube Analytics you can find the watch time for any individual video (and your channel as a whole). It’s worth mapping this against views to get a more nuanced perspective. If you see the views tick up dramatically while the watch time stays largely the same, this tells you that the new views you’re getting are not particularly high quality.

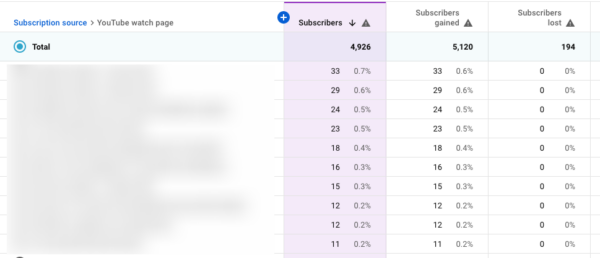
The second metric to care about in regards to impact is subscribers acquired from the video. You can find this via the ‘Subscription source report’ when browsing the channel analytics. Here, by clicking on ‘YouTube watch page’, you can see how many subscribers have been driven from each individual video. This data is most useful when exported and brought into a different platform, so you can compare other metrics on an individual video level.
Channel performance in YouTube
When measuring the success of your YouTube SEO across your channel more holistically, the questions that provide the most insight are about the general direction of engagement and performance. The three questions I typically ask are:
- How frequently are users returning to videos on the channel?
- Where is the traffic coming from?
- Is the channel getting more engagement over time?
Let’s go through these in turn.
1. How frequently are users returning to videos on the channel?
You can get a sense of this by looking at the ‘Audience’ tab in the YouTube Analytics main dashboard. Here you can see a breakdown of new vs returning viewers. As with website analytics, you want to see an increase in both new and returning visitors, ideally at similar rates.
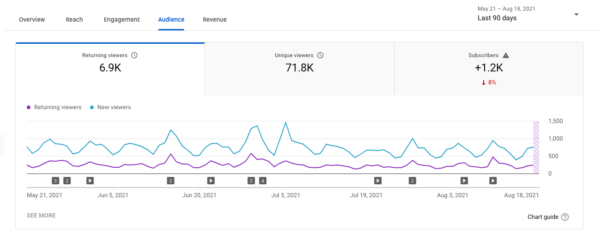
If you see new visitors growing for an extended period but not translating into returning visitors, you can probably conclude that your channel value proposition is not as strong as it ought to be. If that happens, you might want to think about reframing your offering on YouTube. You could publish new types of content, or use cards to encourage users to stick around and watch more of your content after they’ve finished one video.
2. Where is the traffic coming from?
While traffic sources matter at an individual video level, they can also tell a compelling story at a broader, channel level. You want to see a significant portion (if not the majority) of your traffic coming from YouTube Search, Suggested Videos and Google Search.
If that’s not the case, then ultimately you are not making YouTube work for you as a platform, and are instead relying on other marketing channels (usually your website) to drive all of your engagement on YouTube. Great YouTube channels grow their audience base primarily from the platform. So you want to see YouTube-based traffic sources increasing over time.
3. Is the channel getting more engagement over time?
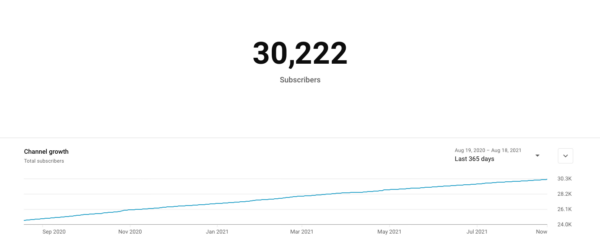
When trying to understand, in the broadest sense, whether your YouTube SEO is on a positive trajectory, you need to look at engagement. The metrics to care about here are watch time, and subscriber numbers. You want to see watch time growing over time, and your subscriber base growing as well. The more engaged users are, the more content they will be watching. And what’s more, the very engaged users eventually become subscribers.
The best report for this in YouTube Analytics is ‘Subscription status’, which you can then view through the lens of ‘Watch time’. Ideally you should see a solid upward trajectory in terms of subscriber watch time. For non-subscribers, you want at least a static steady watch time performance that isn’t decreasing over time.
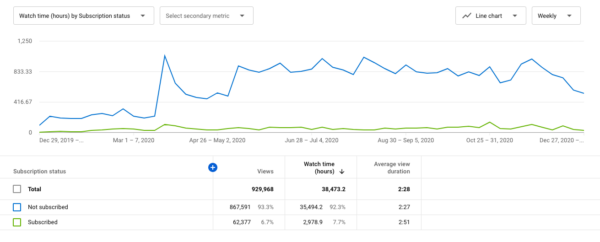
You can also track watch time by traffic source. This helps you determine which avenues of discovery are leading to the best engagements with your content across the board.
The ‘Channel growth’ report also shows us the trajectory of your subscriber numbers. Here we want to see a graph going steadily up and to the right, ideally moving towards that classic hockey stick shape.
Keep reading: What makes a great YouTube channel? »
Ready to optimize for YouTube SEO?
I hope you found this post a useful introduction to some of the important data available in YouTube Analytics. It can tell you a lot about the performance of your videos and help you optimize them for YouTube SEO. So make sure to look at it!
If you want to take things further, you can pull some of this data into Google Data Studio and create a YouTube SEO dashboard. Here’s a template to get you started – just make a copy, then connect your YouTube channel to pull in the correct data!
Read on: YouTube SEO in 5 minutes »
