Check your site’s SEO yourself

One question we get quite often is whether we can help people recover from the drop they noticed in their rankings or traffic. Often, this was a legitimate drop and people were actually in a bit of trouble. However, in most cases, there wasn’t anything wrong with either the traffic or the rankings. In this post, I’ll explain where you should and shouldn’t be looking when evaluating whether your site is doing well or not. Because if you check your site’s SEO every now and then, following the steps below, you’ll gain valuable insights that will help you optimize your site even further.
My traffic dropped!
We’ve seen quite a few clients who claimed to see a drop in their traffic. On investigation, we couldn’t find any such drop anywhere. When checking your traffic, there’s only one place you need to go: Google Analytics.
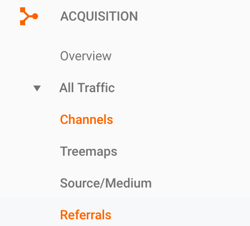
However, using Google Analytics isn’t exactly straightforward, so let me tell you where to look for a drop due to bad SEO. The most important spot to check your site’s SEO, especially its traffic related to SEO, is the Acquisition > All Traffic > Channels section. (read this post for more info on SEO in Google Analytics)

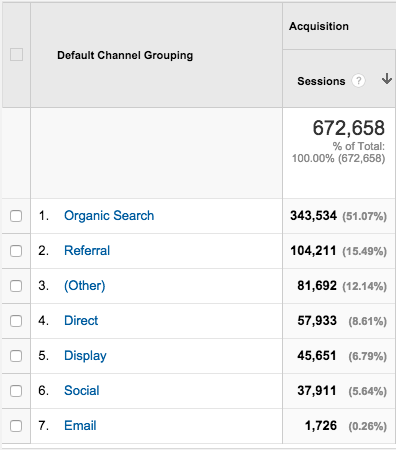
This section will give you a line chart of your site’s total traffic, as well as a complete overview of this traffic divided into different ‘channels’. A channel is basically a couple of sources (where your visitors come from) grouped into one. So all traffic from Bing, Google, Yahoo, Yandex or any other search engine will be combined in the channel ‘Organic Search’. Any traffic from Twitter, Facebook, Pinterest, etc. will be combined in the channel ‘Social’.
When you check your site’s SEO here, look out for a drop in the line chart in this metric. If you don’t see one, you’re probably doing fine. If you do see a drop, don’t panic just yet. There are a few things you can check to make sure this drop is, in fact, related to SEO. Read more about analyzing a sudden drop in traffic.
Organic Search
Google Analytics allows you to see just the traffic from search engines. There are two ways of doing this. The first is probably the easiest: you just click on ‘Organic Search’ in the list:

You’ll now get a line chart and statistics from just this channel. This can be useful, but it also makes it impossible to compare the traffic from this channel with traffic from other channels. So my preference is to select the checkboxes of the traffic channels I want to view and then click the ‘Plot Rows’ button at the top. This will give you a second line in the line chart, like this:

So the blue line represents the total traffic, and the orange line the traffic from search engines. As you can see, there are some spikes in our total traffic that have nothing to do with our traffic from search engines. So they don’t have anything to do with SEO efforts on our part. In fact, we know that newsletters and social media caused these spikes.
And this works the other way around as well: you could have a drop in traffic that has nothing to do with your SEO efforts. Something might’ve gone wrong on your social media, or maybe your newsletter wound up in everyone’s spam folder. So always check the source of the drop, before blaming it on bad SEO.
The graph above is from 2015, by the way. Social and newsletters helped traffic, as you can see, so we decided to optimize that process a bit more. Nowadays we spread out social and newsletters more over the week and as you can see, we have fewer spikes, but overall more traffic (also due to other factors, by the way) :

Check the right time frame and period
As you can see in the screenshots above, the graphs are set to one point per day and cover a time frame of about one to one-and-a-half months. This is fine if your traffic is steady. However, if your business (and therefore your traffic) is more seasonal, this might not be the best time frame. Put it up to a year or half a year so you can check if your traffic is lower than usual around that time.
Also, if your time frame includes the current month, day or week, be aware that the last point in your line graph will always be lower. You see that happening in the second graph; the last point drops off. This doesn’t mean our traffic dropped, it simply happens because the last point is today, and today is still not finished and will accumulate a lot more traffic. The same thing goes for weeks and months.
Read more: What to do if the traffic on your blog is decreasing »
My ranking dropped!
When you’ve gone through these steps to check your site’s SEO, and find that your traffic has dropped, you obviously want to know why. It could be related to your ranking. But this is a bit harder to check, unfortunately. The thing is, Google has personalized search. So what shows up for you when you search for a specific keyword won’t always show up for me. The results are based on your personal browsing behavior and a lot more, which I won’t go into here.
We’ve had clients stating they were already ranking #1 for all their keywords, when really, they weren’t. This can happen when you Google yourself a lot and only click through to your own site. Long story short, it’s pretty hard to use Google to find out how your rankings are doing. Of course, using Google in a private browser session can give you some indication. In fact, most tools aren’t much more than that; an indication.
PageRank
A lot of people still cling to the idea of Google PageRank. However, this doesn’t mean that much anymore. Google deprecated the entire thing as far back as 2009. Besides that, Google has always tried to encourage people to look at other metrics such as Google Analytics. These simply give you far more insights to check your site’s SEO. So simply put: we encourage you to look at more/other indicators.
Ranking trackers
At Yoast, we’re not fans of ranking trackers that give you a very general idea of how your ranking is doing. It doesn’t matter how you compare to all the other websites out there, it matters how you’re doing in your field of work.
It can be problematic that these trackers track all your rankings. This won’t be an issue for everyone, but for us, it means that our rankings fluctuate a lot. The cause of this is that we rank well for a number of broader terms. The best example of this: when we still had our Google Analytics plugin, we ranked very well for the term ‘Google Analytics’. One of our Knowledge Base articles ranks rather well for ‘Google Search Console’. Rankings for keywords like that tend to fluctuate quite a bit and there’s a lot of searching going on for these terms. Every time we drop or rise a bit, the rankings in these trackers shoot up or down as well, even though the users weren’t looking for us. They just wanted to go to Google Analytics and check their stats.
So, as we have seen, these tools can give a general indication, perhaps a trend in some cases, but shouldn’t be valued as anything more than that.
Google Search Console
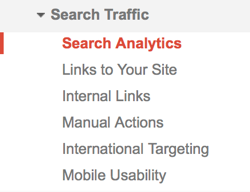
Google Search Console (GSC) is one of the tools that I would recommend using to check how your site is doing. Let me show you where to find the most important metrics:

The ‘Search Analytics’ section shows you how many impressions your site has had and how many of those resulted in clicks. An impression is every time your website shows up in the search results the user is looking at. If either of these metrics is going down, you’ll know something is up. Before you draw any conclusions, play with the time frame here as well, so you know for sure it’s not a temporary drop.
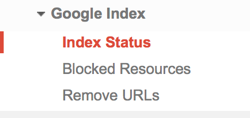
Next is the Index Status section:

This metric will show you how many pages are indexed in Google. This is obviously an important metric as well, so a steady or rising line is what you’re looking for. If this line is dropping too fast (without you having disallowed pages, for example), this is definitely something to look into.
So, check your site’s SEO on a regular basis!
When you want to check your site’s SEO yourself, I recommend only paying attention to Google Analytics and Google Search Console. Other tools are fine for giving a general idea or indication, but nothing more than that. If you suspect something’s wrong, be sure to check the things I’ve mentioned, so you know for sure it’s an SEO problem.
Do you think we’ve missed anything here? Or do you just have some more questions? Let me know in the comments!
Keep reading: Tracking your SEO with Google analytics: a how-to »


Discussion (23)